 Strateva
Historical research — outside the current commercial scopeKept for the methodology it demonstrates, not as an example of something you could send today. Prediction markets and derivative-led strategies are not accepted.
Public research example — internal demonstration
F2 Anticipator V2 — Can a late-book signal anticipate 5-minute BTC Up/Down markets?
Formal verdict: Revision requiredA causal, book-only model estimated the final probability of Up and traded only when expected edge exceeded costs. The temporal OOS showed that the predicted edge did not survive realistic execution assumptions.
This is not a client engagement. It is a public Strateva research example — a frozen strategy taken through the same internal validation protocol used for client audits, to demonstrate the methodology. It is not a validated trading system and not evidence of future profitability.
View the repository on GitHub (opens in a new tab)Strategy summary
F2 Anticipator V2 trades Polymarket’s BTC Up/Down 5-minute markets. At T+150 seconds, it estimates the probability that Up will settle.
That estimate is built exclusively from causal, book-only observations captured at T+90, T+120, T+135 and T+150: price, spread, displayed depth and order-book imbalance for both sides.
It buys the side with the largest estimated value, and only when the expected edge is at least 2 cents per share after taker fees.
The model, its features and the 2-cent threshold were frozen before the strict post-freeze evaluation window began.
This is a research replay of historical PMData order-book snapshots, not a live trading bot: it does not place orders.
Economic hypothesis
The frozen hypothesis: between T+90 and T+150, changes in the BTC binary order book may carry enough information to estimate the settlement probability before the market’s conventional T+180 entry point. A deliberately low-capacity logistic model should be able to exploit temporary mispricing — but only when its estimated value exceeds the visible ask plus the dynamic taker fee.
Before any OOS evaluation, six survival criteria were frozen and all had to hold: at least 300 signals across at least 15 qualified days; positive average EV; a day-level bootstrap 95% lower bound above zero; positive EV in both temporal halves of the sample; positive EV under a 1-cent execution stress; and a model Brier score below the raw order book’s own Brier score.
Retuning the model, features or threshold on the same OOS sample after seeing these results would create a new, contaminated hypothesis — the frozen V2 hypothesis is treated as closed on this sample regardless of the outcome.
Signal and timing convention
The causal timing convention is explicit and checked by the model-integrity self-test in the repository:
- Bilateral book snapshots are captured at T+90, T+120, T+135 and T+150 — strictly before the trade decision, never after.
- The frozen logistic artifact estimates P(Up wins) directly from those causal snapshots.
- Net edge is computed for both Up and Down using a dynamic taker-fee model.
- The strategy trades the better side only when edge is at least 2 cents, the ask sum is between 0.98 and 1.04, entry price is between 0.05 and 0.90, and displayed ask depth is at least five shares.
p_up = model(book_90, book_120, book_135, book_150)
fee(p) = 0.07 * p * (1 - p)
edge_up   = p_up       - ask_up   - fee(p_up)
edge_down = (1 - p_up) - ask_down - fee(1 - p_up)
trade side = argmax(edge_up, edge_down)
enter only if max(edge_up, edge_down) >= 0.02
Temporal OOS protocol
- Evaluation period: 7 June 2026 to 10 July 2026 — 34 calendar days.
- 29 complete, qualified trading days out of those 34.
- 8,352 markets in the evaluation window; 8,177 valid feature rows survived the causal book-freshness checks.
- 2,007 quote-level signals met the edge, price-band and depth conditions.
- Confidence intervals use a day-level bootstrap with 10,000 resamples.
- No book snapshot older than 2 seconds is accepted at any decision timestamp.
- The taker fee model is 0.07 × p × (1 − p), applied dynamically to the model’s own probability estimate.
- A quote-persistence test requires the same or a better executable quote to remain available one second later.
- Raw licensed PMData is excluded from this repository and this page; only aggregate, non-proprietary outputs are published.
Results
- Average predicted edge was +3.31c, but realized quote-level EV was only +0.04c.
- The model’s Brier score was 0.165898, against 0.165569 for the raw order book — the model did not improve probability calibration relative to the market.
- Higher predicted-edge quartiles did not produce higher realized EV.
- Quote persistence deteriorated among the supposedly strongest signals.
- The later half of the monthly sample and the strict post-freeze sample were both negative.
Charts
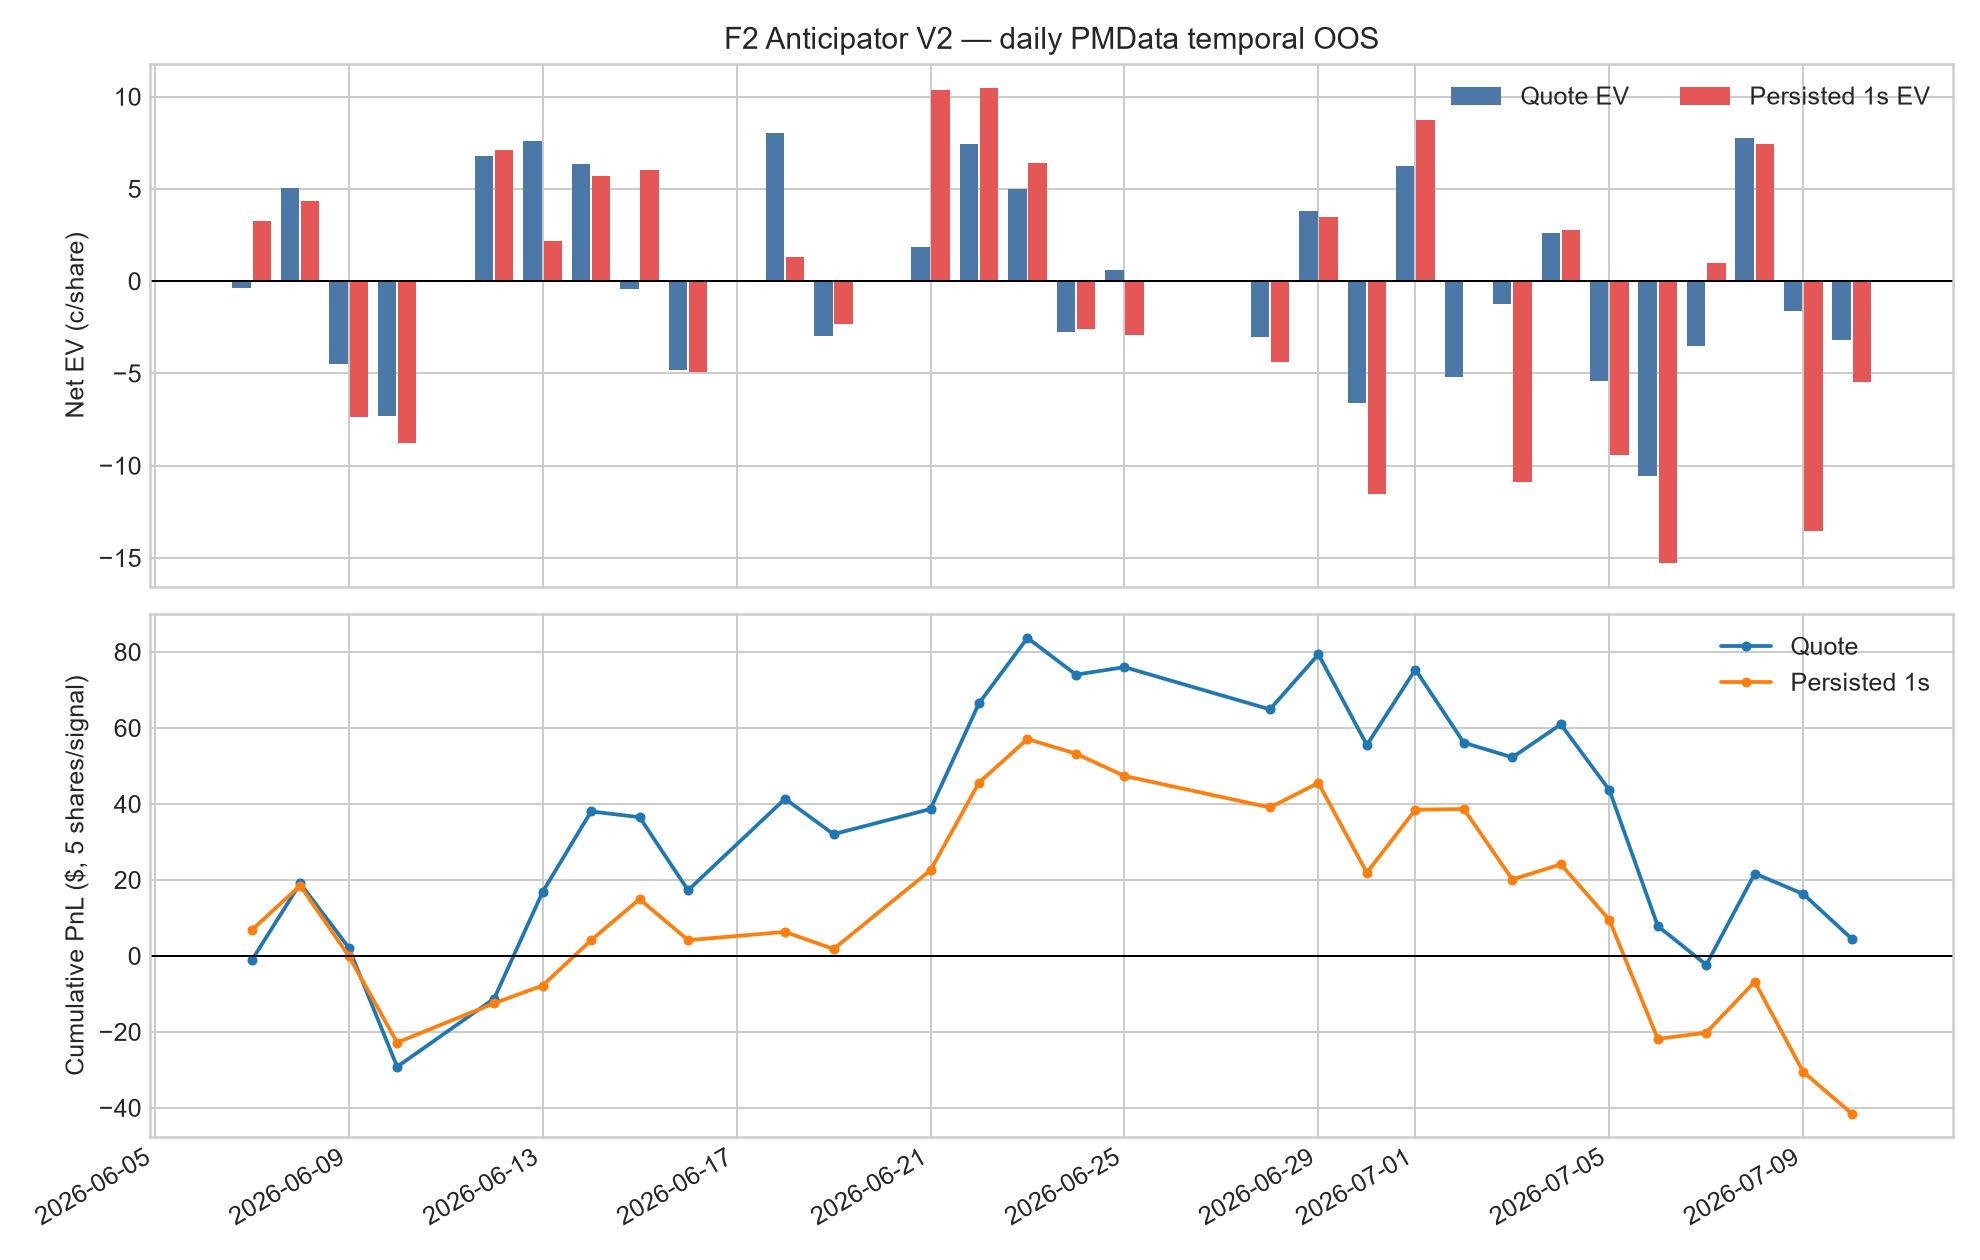
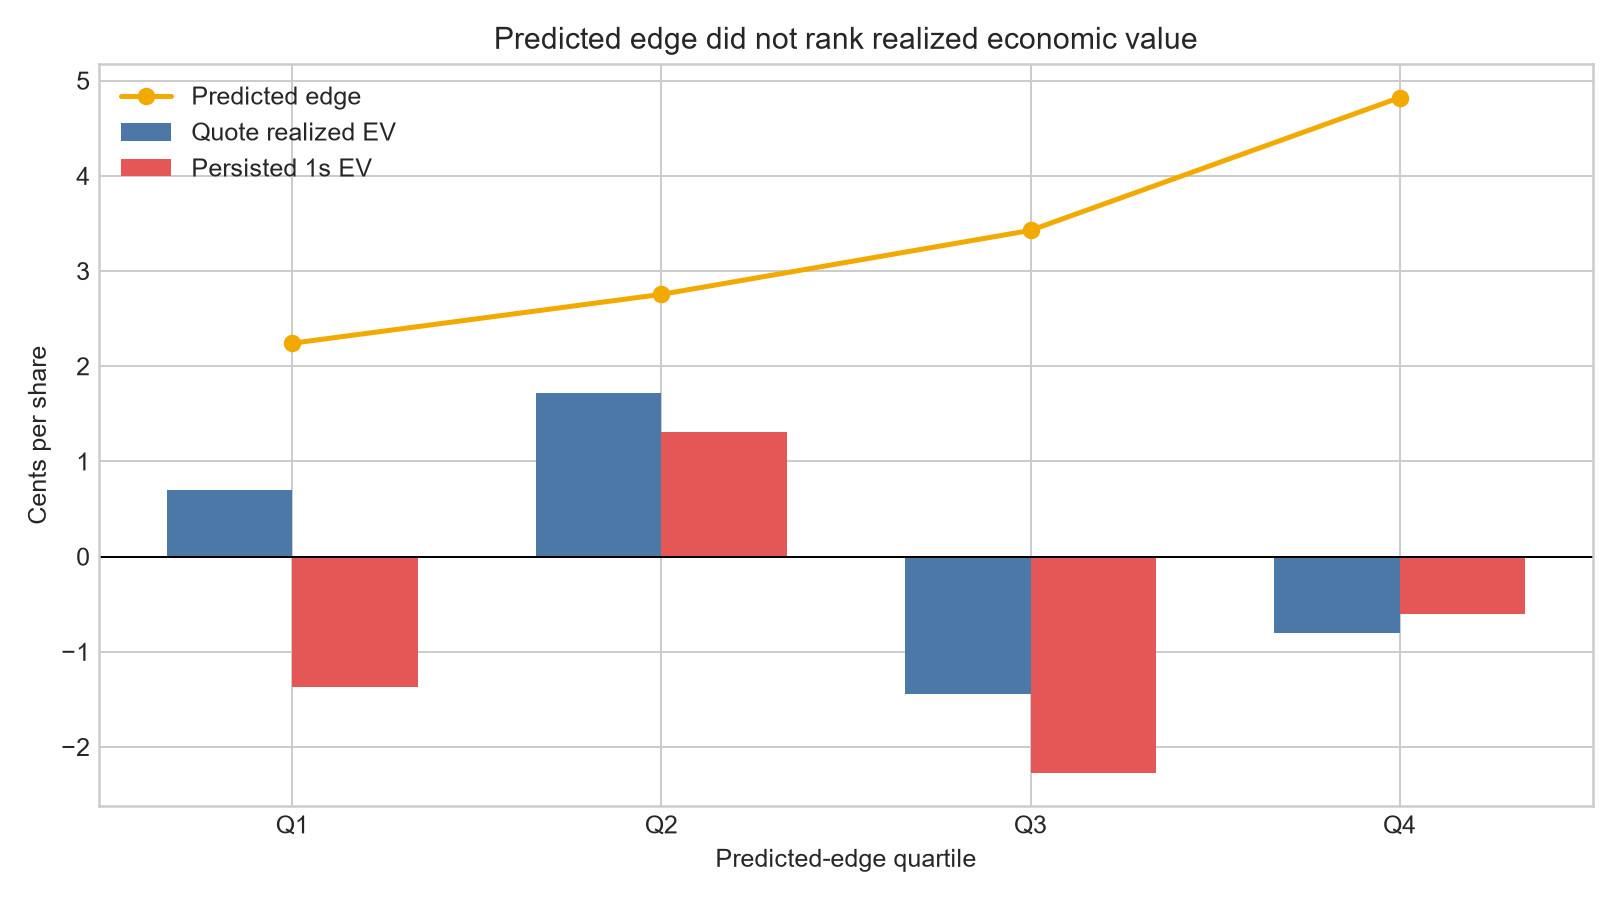
Why the strategy failed
A NO-GO here is a successful validation outcome, not an embarrassment: the protocol did exactly what it was built to do — reject a plausible-looking edge that does not survive realistic scrutiny.
- The apparent model edge was not calibrated against realized outcomes.
- The result was highly sensitive to quote persistence and execution stress.
- Performance deteriorated after the model freeze.
- The strongest predicted signals did not produce the strongest realized returns.
- A marginally positive headline estimate with a confidence interval crossing zero was insufficient.
- The persisted and strict post-freeze results were negative.
What this case demonstrates
- Predicted edge must be checked against a realized-outcome benchmark, such as book-relative Brier score, before it is treated as informative.
- A quote-persistence and execution-stress test can invalidate an average-EV result that looks acceptable on paper.
- A strict post-freeze evaluation window is a meaningful additional control beyond a monthly temporal OOS.
- Segmenting by predicted-edge quartile can reveal that a model’s most confident signals are its weakest, not its strongest.
- Freezing the model, features and threshold in advance is what makes a NO-GO a real, uncontaminated result rather than an invitation to keep retuning.
Reproducibility
- Frozen logistic-model artifact with a SHA-256 manifest binding the model to its spec.
- The exact feature list, fee model and execution contract are committed in the repository.
- A causal, resumable PMData replay script verifies the frozen model hash before scoring.
- Aggregate, machine-readable JSON and CSV results are committed alongside the code.
- A reproducible chart-generation script regenerates both committed charts from the aggregate results.
- Unit tests and a model-integrity self-test verify the frozen artifact before every replay.
- Raw PMData files and market-level derived rows are intentionally excluded: the source dataset is licensed and cannot be redistributed.
Limitations
- Only 29 complete, qualified days were available in the primary OOS window.
- The 34-day block was temporal OOS relative to training, but four June days had already been viewed during V2 development.
- The cleaner strict post-freeze slice contained only 12 complete days.
- Confidence intervals remain wide relative to the estimated effect size.
- Quote persistence is only a proxy for fillability, not a complete queue-position or market-impact model.
- Results apply to the tested BTC 5-minute Polymarket sample, not necessarily to other markets or timeframes.
- PMData’s licensed raw files cannot be independently redistributed, which limits third-party re-verification to the aggregate outputs published here.
- This is historical research, not investment advice or a forecast.
Formal verdict
Formal validation summary
PASSPASSFAILFAILFAILDeployment: NOT TESTED
A PASS on causal timing or reproducibility only means the experiment was built correctly — it is not evidence that the strategy is profitable. Correct implementation cannot rescue a claim that fails on calibration and economic viability.
Formal verdict: Revision required
Formal result recorded in the signed report: NO-GO — Signed reports keep the formal wording they were issued with. It is shown here exactly as delivered, because a document that changes after signature is not evidence.
NO-GO due to economic and temporal-stability failure. The signal did not demonstrate incremental, monetizable edge under quote persistence, execution stress and a strictly post-freeze evaluation. Progression to shadowing is not recommended without a new hypothesis and a fully independent validation.