 Strateva
Public research example — internal demonstration
Volatility Term-Structure Strategy
A transparent SPY allocation example combining a lagged VIX term-structure filter, realized-volatility targeting, leverage limits and explicit turnover costs.
This is not a client case study. It is a deliberately simple strategy, built internally, to demonstrate how a transparent quantitative strategy can be documented and reviewed — not evidence of a validated or profitable trading system.
View the repository on GitHub (opens in a new tab)Strategy overview
The strategy allocates to SPY using two other public instruments as inputs: the VIX index and the VIX3M index.
It holds SPY only when the lagged VIX3M/VIX term-structure ratio is above 1.0 — a simple regime filter for calmer volatility conditions.
When the regime filter is on, exposure is sized to target 10% annualized volatility, using a 20-trading-day trailing realized-volatility estimate, and capped at a maximum of 2x leverage.
A simplified linear cost of 1 basis point per unit of turnover is charged on every change in exposure.
Timing convention
The causal convention is explicit and unit-tested in the repository:
- Both signal features — the VIX3M/VIX ratio and realized volatility — are lagged by one trading observation.
- Exposure on row t is therefore computed from information available only through t-1.
- That exposure is applied to the row-t close-to-close SPY return.
- No additional execution shift is used in the published reference implementation.
term_structure_lag[t] = (VIX3M / VIX)[t-1]
realized_vol_lag[t]   = std(SPY returns, 20 days)[t-1] * sqrt(252)
exposure[t]           = 1(term_structure_lag[t] > 1.0)
                        * min(0.10 / realized_vol_lag[t], 2.0)
strategy_return[t]    = exposure[t] * SPY_return[t]
                        - turnover[t] * 1 bp
Snapshot metrics
Sample: 2013-02-01 to 2026-07-17 — 3,384 aligned trading observations.
Strategy vs. SPY buy-and-hold
Additional diagnostics
Metrics are descriptive history from the committed repository snapshot, not a claim of future performance.
Charts
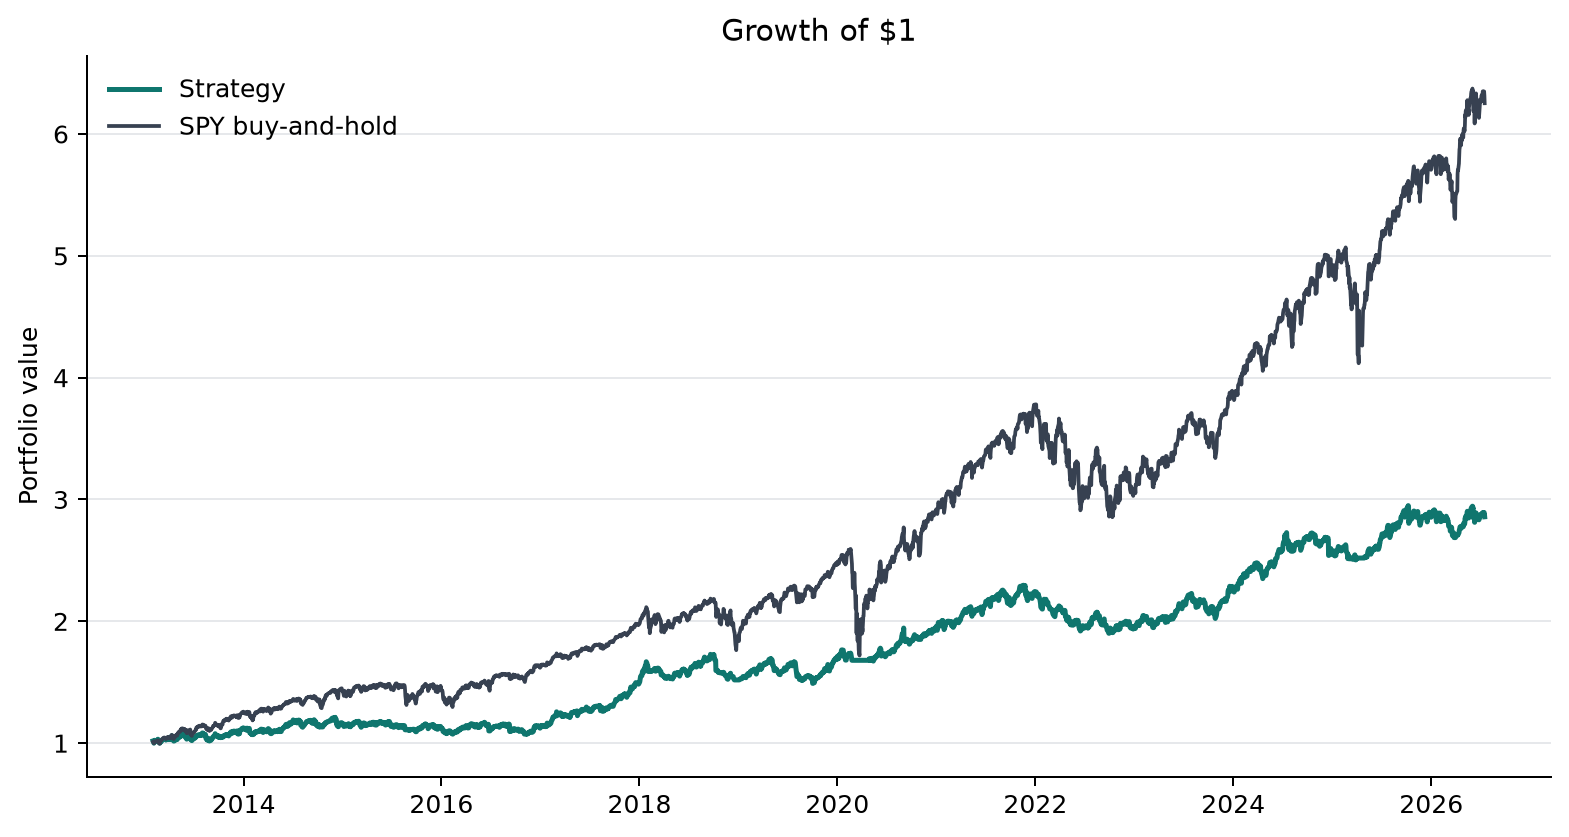
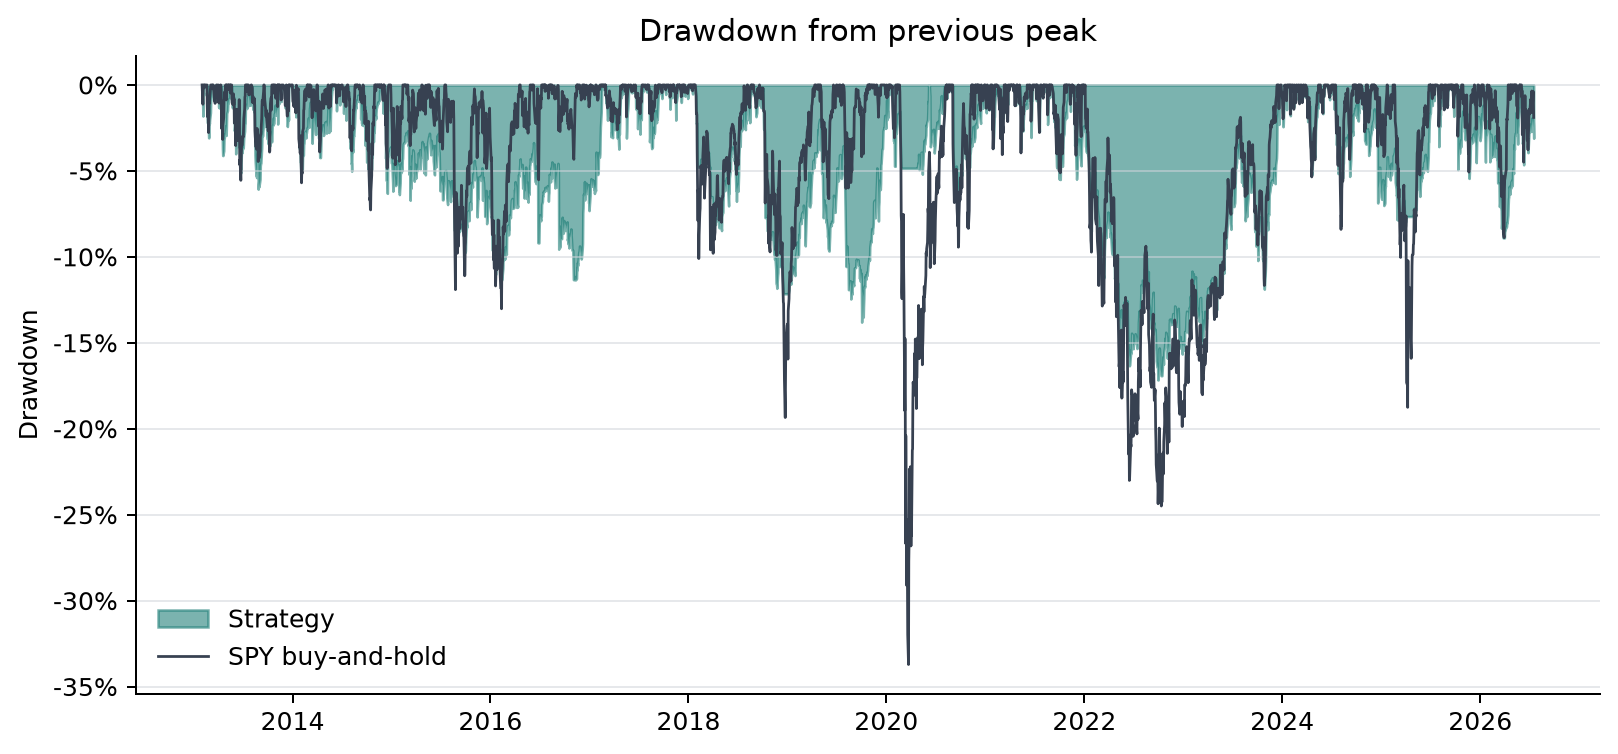
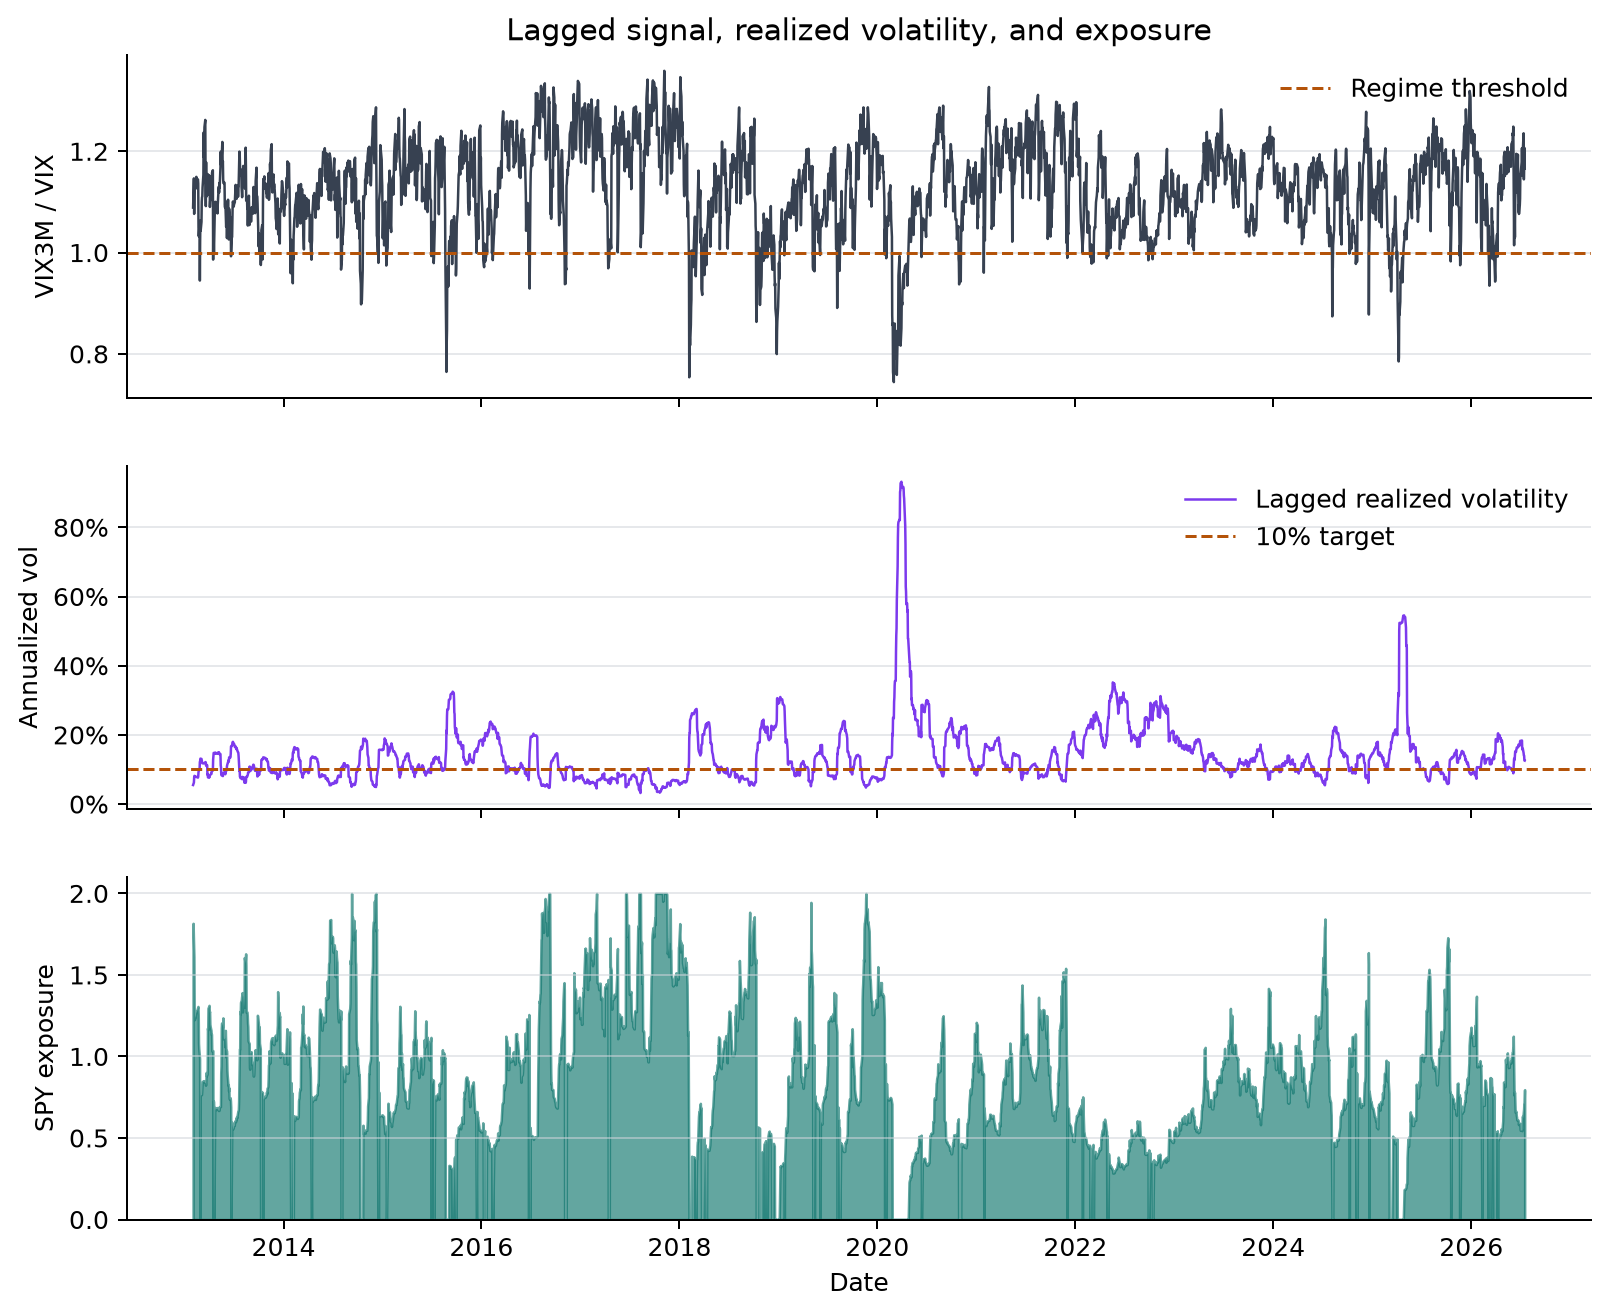
What this example demonstrates
- Explicit timing conventions matter: stating exactly what information each row of exposure uses, and when, is what makes a backtest auditable.
- Volatility targeting can reduce realized volatility and historical drawdown relative to a buy-and-hold benchmark.
- Lower risk does not automatically imply benchmark outperformance — this example underperformed SPY buy-and-hold on CAGR and total return over the sample.
- A clear, like-for-like benchmark prevents risk reduction from being mistaken for alpha.
- Reproducible code, machine-readable metrics and derived data make a result inspectable, rather than asking for trust.
Reproducibility
- Built and tested with Python 3.12.
- Pinned top-level dependencies, listed in the repository’s requirements file.
- A standalone analysis script reproduces the metrics, the derived CSV and all three charts from a single command.
- Machine-readable metrics are committed alongside the code, together with the exact strategy configuration used.
- The derived CSV of aligned returns and exposure is committed and bound to the metrics file by a SHA-256 hash, so the snapshot cannot silently drift from the numbers shown here.
- Synthetic-data unit tests cover feature timing, exposure bounds and cost accounting.
- A GitHub Actions workflow runs the test suite on every change.
Limitations
- Yahoo Finance is a convenient public data source, not a point-in-time institutional archive — historical observations may be revised.
- VIX and VIX3M are regime indicators; the strategy does not trade VIX products directly.
- The backtest does not model bid/ask spreads, market impact, taxes, financing, borrow constraints or intraday execution.
- The cost model is a simplified, linear cost per unit of turnover.
- The parameters were chosen for demonstration and are not presented as universally optimal.
- This is a historical example, not investment advice or a forecast.